Traffic forecasts overestimated. by Andrew Herington
The explosive report from Infrastructure Australia “Spend more, waste more” makes damning criticisms of the record of State road bodies in assessing the economics of road projects. But it also contains some devastating information about trends in traffic projections.
The widely used engineering assumption is to project a continuous increase in future traffic growth of between 1.3% to 2%. All the work done for the East West Link by Veitch Lyster Consulting used this range of growth – based on this being the average for the last 17 years and would continue on the same pattern for the next 20 years. This extrapolation takes no account of changing trends but is used to justify the massive investment to expand road capacity.
The following table from page 24 of “Spend more, waste more” compares road agency forecasts for growth in road travel in the decade to 2011-12 versus what actually happened.
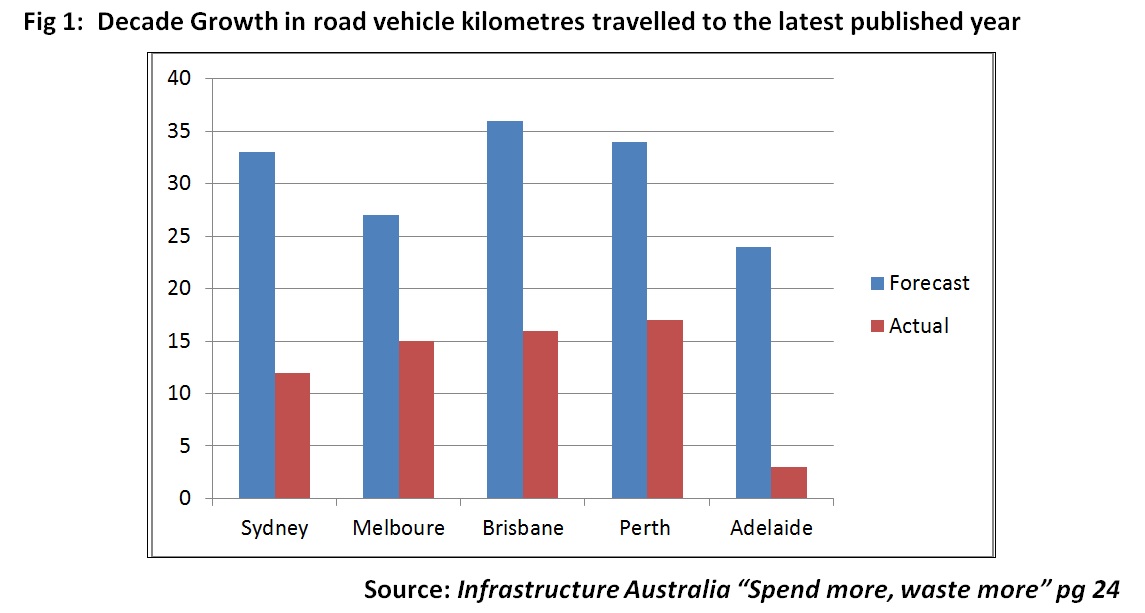
This table is based on BITRE Working Paper 71 Estimating Urban Traffic and Congestion Cost Trends for Australian Cities (2007) and actual statistics for same reported by BITRE to 2011-12.
For Melbourne, this shows despite projecting a 27% increase in traffic there was only 15% growth over 10 years. Extrapolating this data by 20 years suggests there could be a massive gulf between the forecasts used to justify the East West Link and the likely actual outcome.
In 2010 Infrastructure Australia pointed out to BITRE that the statistical approach to these projections appeared deeply flawed and that urban congestion levels were growing at around half, or less than half the forecast rate:
At the time – and a number of times since – Infrastructure Australia asked that these forecasts be reviewed and their implications for current and planned urban road projects re-examined. In 2014 – four years later – no such review has taken place. It is not clear to Infrastructure Australia why this has not been attended to, although revising forecasts down would almost certainly result in pressure to reduce budgets for urban road programs.
Accordingly, the road system’s flawed analytical assumptions about matters of national importance appear to be giving the wrong impression to governments of the relative importance of road congestion (and the need for road spending) and public transport projects.
Infrastructure Australia “Spend more, waste more” pg 24
The underlying cause of this error in forecasting is that it is no longer “business as usual”. Since 2004 there has been a substantial and unrecognised change in people’s driving behaviour with a drop of over 10% in per capita kilometres driven. In the case of Melbourne it is 12.5% and the upturn in public transport is particularly strong. The more investment in public transport, the more significant this shift in mode would be and the more inaccurate the earlier projections.
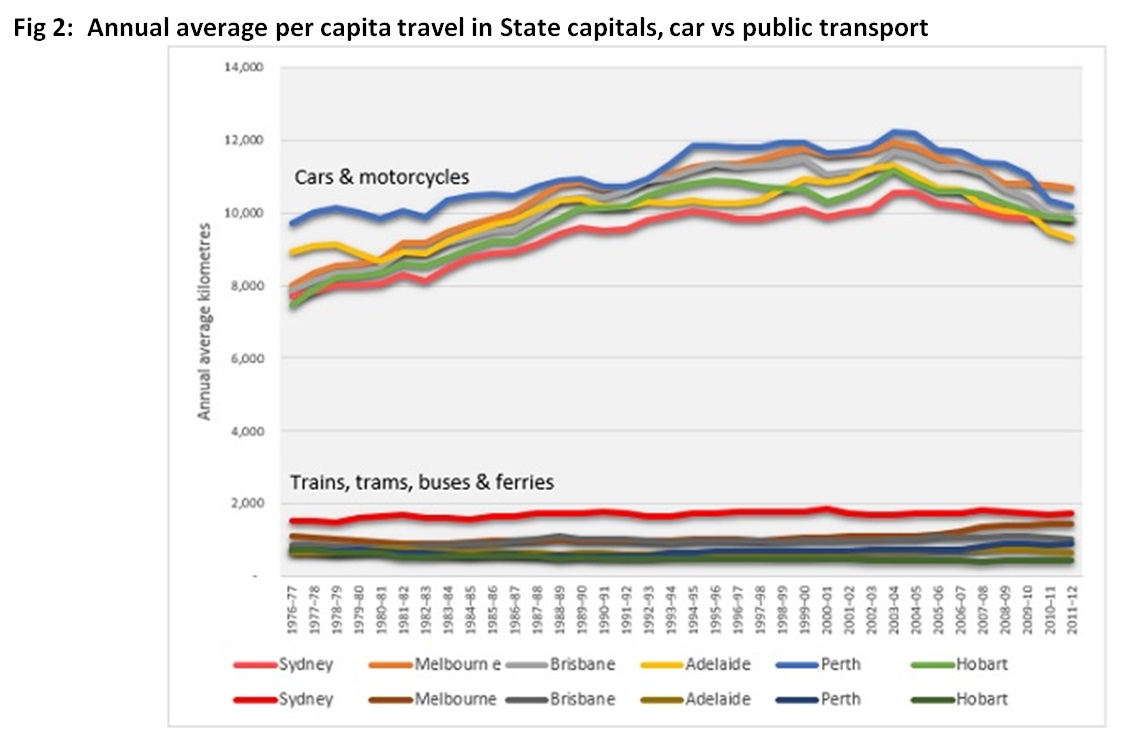
Source: Bureau of Infrastructure, Transport and Regional Economics Yearbook 2013
Alan Davies on The Urbanist blog for Crikey has discussed the factors behind this decrease in detail in four articles since 2012: Will we drive a whole lot less in future?, What’s really putting the brakes on millennial’s driving?, Why are Australians driving less than they used to?, Are millennials driving less?,
These include:
- People making fewer trips as travel demand reaches saturation and fuel prices rise;
- Traffic congestion eroding the benefits of car travel, particularly in peak times;
- Trends in urban development with more major activity centres reducing trip length
- A demographic shift back to the inner city which is rich in public transport;
- A focus on healthy living with more people walking and riding for shorter trips;
- Young people getting their licences later (and doing without cars as they struggle with debts and other living costs);
- More young adults in tertiary education, lower workforce participation, and starting families at a later age.
- As the population ages, a growing proportion of people who no longer drive or do so infrequently
- Greater use of email and new technologies to reduce the frequency of face to face meetings
On top of these trends, cars are becoming more efficient and produce less polluting gasses and CO2. On the other hand population growth offsets the reduction in per capita use resulting in a small growth in total miles driven.
The trends in mode share by age are given in this fascinating SMH article from last September Gen Y take a sharp U turn from driving (13 September 2013) with an interactive device to look at each age group. These trends are likely to continue and the population will continue to age.
The Brumby Government had a target of achieving 20% of motorised trips by public transport by 2020. By 2010 this had reached 13% but has since stalled and the Napthine Government ditched the target. A return to investments in more trains, trams and buses could still see this target reached – which would mean a further drop in per capita car driving.
The forecasting used to justify the East West Link is primitive and fails to take into account the trends in travelling patterns or the impact of alternative investments. The public perception that congestion will inexorably grow is simply wrong.
Also see Alan Davies, The Urbanist: Are government traffic congestion forecasts too high? (31 July 2014)