Alan Davies: Do traffic counts support the case for Melbourne’s East-West Link?
Traffic counts on existing roads along the proposed alignment for Melbourne’s East-West Link show volumes were static or in many cases declined – by as much as 15% – between 2002 and 2011
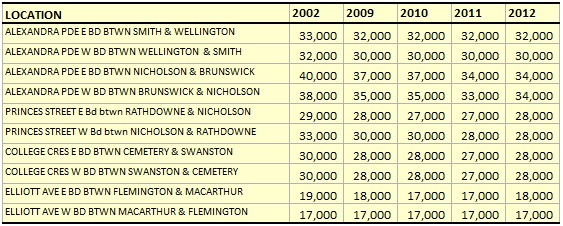
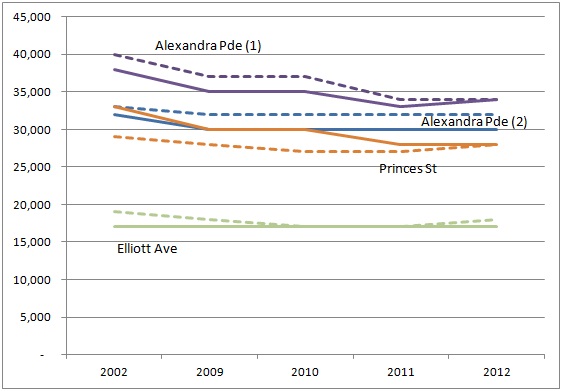
Annual average daily traffic volumes (AADT) along the route proposed for the East-West Link freeway (source: VicRoads)
The first exhibit shows annual average daily traffic volumes at a number of locations on existing roads along the alignment proposed for stage one of the proposed East-West Link road tunnel. The counts were done by VicRoads and published in February 2013, Arterial road traffic volumes.
The counts represent the sum of all traffic using these road in a year, divided by 365. Westbound volumes (solid line) and eastbound volumes (dotted line) are shown separately. The locations plotted in the first exhibit are:
- Alexandra Parade between (1) Nicholson and Brunswick Sts and (2) Smith and Wellington Sts
- Princes St between Rathdowne and Nicholson
- Elliott Ave between Flemington Rd and Macarthur Rd
There’s more detail in the second exhibit. Those with a strong interest should download the excel file from VicRoads’ site which includes additional counting locations (these are consistent with the overall trend reported here).
Relative to 2002, the most recent counts show either static volumes or, in most cases, a decline. Some of these are large e.g. eastbound traffic on Alexandra Pde between Nicholson and Brunswick fell 15.0% over the period. Traffic westbound on Princes St between Nicholson and Rathdowne declined 15.2%.
These counts include all motorised traffic i.e. cars, vans and trucks. When trucks are broken out separately, there’s a similar pattern of either static or, in most cases, lower volumes in 2012 compared to 2002. For example, on the westbound section of Alexandra Pde between George St and Queens Pde, daily truck volumes fell from 2,200 to 1,900 (total daily traffic fell from 41,000 to 36,000).
We usually expect declining traffic speeds associated with rising demand to increase traffic volumes, as drivers require less “shy space” between themselves and the vehicle in front. However that relationship isn’t linear; it might be that peak period speeds on this route are so slow it results in lower volumes.
On the other hand, these are all-day counts. For the majority of the day this route is busy but it isn’t grid-locked – there’s space capacity at these times. As population has increased significantly since 2002, we should expect traffic volumes to have increased too. At the very least traffic should be static or increasing slightly, not declining.
Perhaps the fall reflects an improvement in travellers’ access to alternative modes. Or perhaps it’s an indication of the generalised decline in the propensity to travel, particularly among younger cohorts.
Traffic is an arcane art so maybe there’s a straightforward technical explanation and no cause for concern. If so, perhaps Victoria’s Transport Minister, Terry Mulder, can enlighten voters.
A tunnel with three uninterrupted lanes in each direction would undoubtedly induce additional traffic (the government says 80,000 vehicles per day total) but the evident historical decline in travel along the existing route needs to be explained before committing $6-8 billion to stage one of the East-West Link.